BROOD CONTROL MODE
|
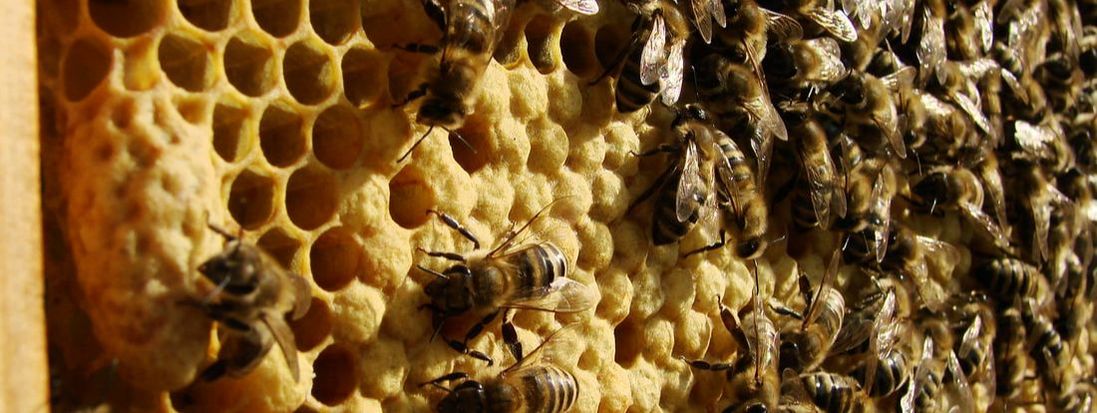
This procedure is designed to check the relative number of brood in the family of bees, mainly in winter-spring and autumn, that is, in the absence of significant work on the collection and processing of honey.
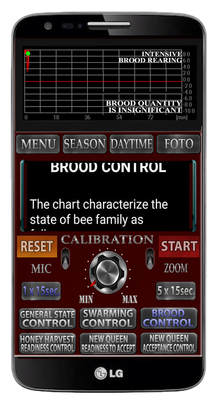
The Brood Control mode shows the ratio between brood care, and other in-hive works. This mode allows you to see the beginning of the brood's withdrawal during wintering and its build-up in spring. The screen of this mode is made in the form of a graph, since the bees' signals are not stable and it takes some time to see the main trend. They are not stable during the day and at different times of the day. The chart can have many sharp jumps, which depends on the number of bees and the work they perform |
The chart characterize the state of bee family as follows :
- If the graph is red and is situated at the very top of the screen, then the family is intensely caring for the brood.
- If the graph is red and is situated near the zero line, this usually means activation of brood care process after its absence, or decreasing the relative amount of brood requiring care, if it previously exists.
- If the graph is white and is situated near the zero line, then after the absence of brood, we can talk about the beginning of the process of building up the strength of the family. In the case of previous presence of a large number of brood, it can be said about significant decrease of the number of brood, requiring attention of young bees.
- If the graph is white and is situated in the bottom of the screen, you can talk about the almost complete absence of brood.
- The larger the amplitude of the oscillations of the graph down, the less bees are engaged in care for the brood.
- The larger the amplitude of the upward trend, the less bees are engaged in in-hive works, and more bees are caring for the brood.
- The less fluctuation in the schedule, the more uniformly all works are done in the family, the less bees are changing the types of activity, depending on the need. This indicates a sufficient number of bees in the family and about presence of balance in their age composition.
This mode takes into account the fact, that during the transitional season in the family there can be passive, unemployed bees. This is why, this mode is recommended to be used mainly during spring and autumn, as well as in the late evening time in the summer. In summer, for analysis of the state of the bees' family, it is recommended to use Honey Harvest Readiness Control mode, where the honey collecting activity of bees in summer is taken into account, and included a slightly different view of the in-hive works of the bees.
It should be noted again, that indications, which you see on the chart, are relative, and may fluctuate, depending on the time of day and season. Naturally, intermediate values can occur both, during the day time, and during honey harvest season, but in general, the understanding of the trend persists.
Bearing in mind the fluctuations in the activity of bees, we have made a graph that allows us to see not a momentary state of the family, but a trend in time. Therefore, in order to obtain more reliable data, it is necessary to spend a certain time on the measurement, and to obtain a graph for a longer period of time. We usually use intervals from 5 to 15-20 minutes, depending on the complexity of the situation
|
|
|
